Why We Don't Use RSI or MACD for Divergence (And What Our System Uses Instead)
Most trading education focuses on RSI or MACD for spotting divergence. They are the most common tools for the job. But here's the uncomfortable truth that becomes clear when you focus on systematic execution: for precise reversal trading, they are flawed tools. They often produce ambiguous, lagging signals that lack the clarity needed for consistent contrarian execution.
This article will explain the core weakness of these traditional indicators and introduce the professional-grade tool we use instead, one that measures the conviction behind market moves, not just the momentum.
The Flaw in Traditional Momentum Oscillators
The fundamental problem with indicators like RSI and MACD is that they are simple momentum oscillators. They measure the speed and rate of change of price. While this can be useful, it doesn't answer the most critical question for a reversal trader: Is the conviction of buyers or sellers actually fading?
This leads to common problems:
- Ambiguous Signals: In a strong trend, RSI can stay "overbought" for long periods, providing multiple weak divergence signals that fail.
- Lagging Information: Because they are based on moving averages and price calculations, they often show divergence after the most opportune entry point has passed.
A systematic approach requires clean, objective signals, not ambiguity. That's why our methodology relies on a different type of data entirely.
The Systematic Alternative: Measuring Conviction with Cumulative Delta Volume (CDV)
So, if traditional momentum oscillators are flawed, what's the alternative? Our systematic approach is built around a professional-grade indicator that measures the real-time conviction of buyers and sellers: Cumulative Delta Volume (CDV).
"Delta" in this context refers to the net difference between aggressive buyers hitting the 'ask' price and aggressive sellers hitting the 'bid' price at any given moment. CDV simply keeps a running total of this value.
Unlike RSI or MACD, which are lagging calculations based on price, CDV provides a direct look at the "engine" of the market. It answers the most important question for a reversal trader: Is the aggressive participation required to sustain this trend actually fading?
A divergence with CDV is powerful because it shows that even as price makes a new high or low, the force behind that move is disappearing. This is a direct signal of trend exhaustion.
To get the clearest possible signal, our methodology exclusively uses the CDV line, not the more common CDV candles. This smooths out market noise and provides an unobstructed view of the indicator's trend, making divergences against price action clean and unambiguous.
A Live Trade Example: Spotting Trend Exhaustion in the Dow Jones
Theory is one thing, but a real trade makes the concept clear. Let's break down a systematic reversal trade on the E-mini–Dow Jones Futures ($YM) to show how this works in practice.
The Signal: Clear Bearish Divergence
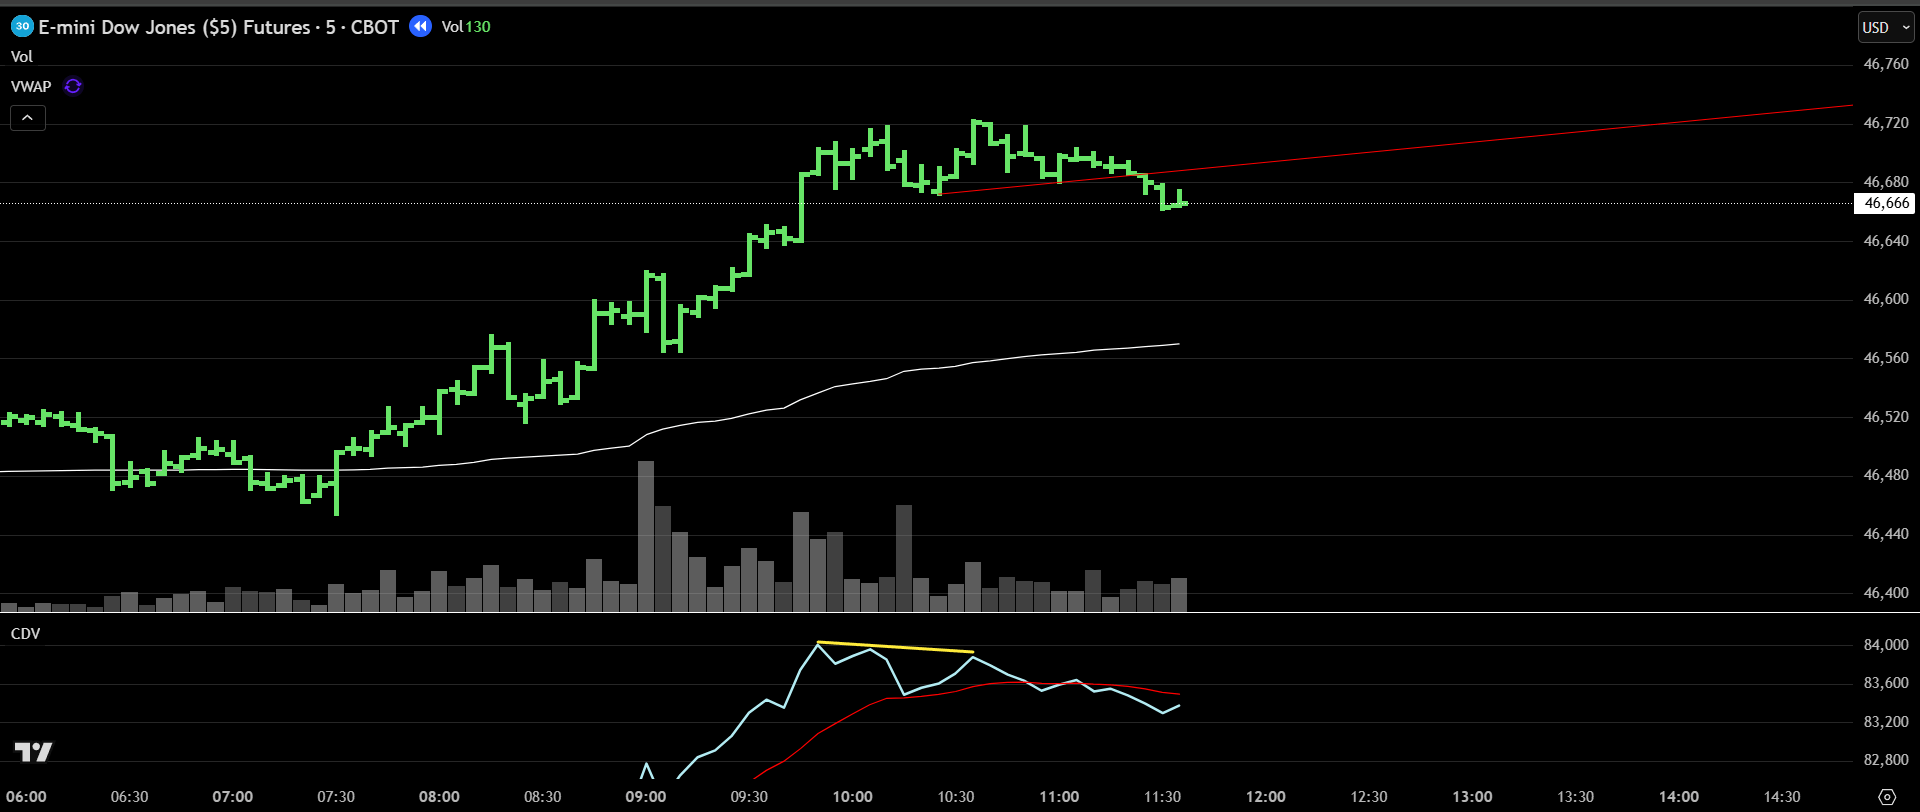
Dow Jones 5-minute chart showing price making higher highs while CDV makes lower highs
Looking at the 5-minute chart of the Dow Jones during the morning session, price is pushing to new highs, a move that would trap many breakout traders into going long. However, the Cumulative Delta Volume (CDV) line below tells a very different story.
While price makes clear higher highs, the CDV line is making distinct lower highs. This is textbook bearish divergence. It's a direct signal that the aggressive buying pressure is fading and that the upward trend is losing its conviction.
In our systematic approach, this is the primary alert that a high-probability reversal setup may be forming.
The Confirmation & Execution
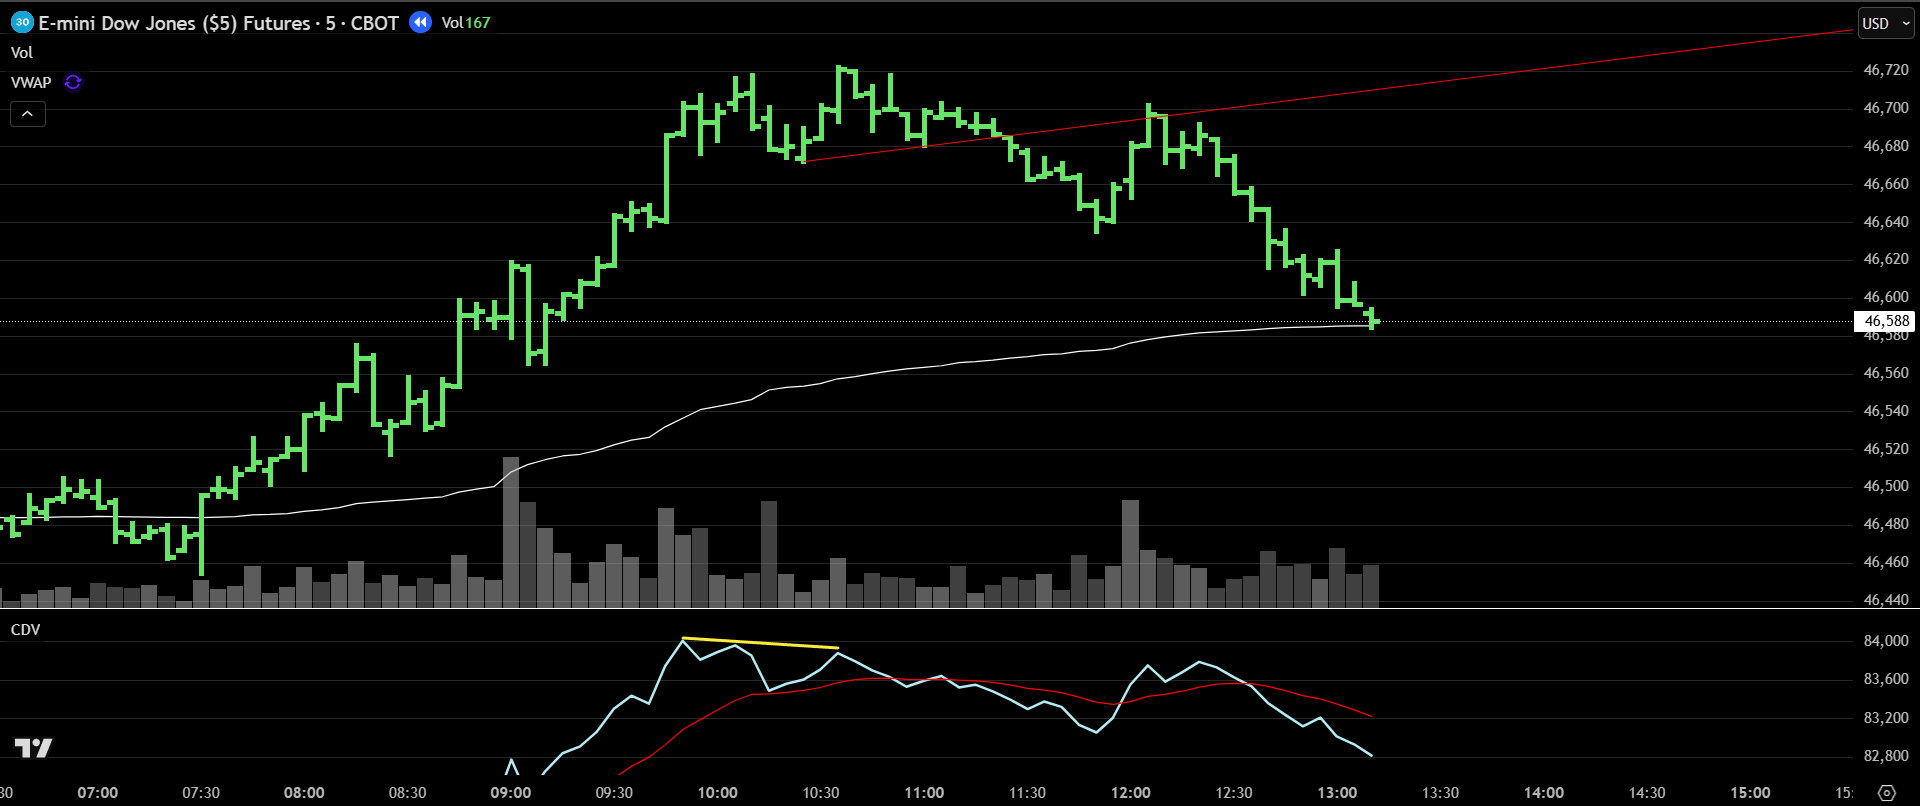
Dow Jones trendline break confirmation and trade execution showing 70-tick profit
The divergence signal is an alert, not an entry trigger. Our systematic approach requires objective confirmation, waiting for a clean break of the immediate trendline.
Once the trendline was broken, a short trade was executed. The market then reversed, as anticipated by the fading conviction shown on the CDV, resulting in a 70-tick profit.
View the live trade announcement on X →
This trade perfectly demonstrates the importance of patience: waiting for a high-quality signal, then waiting for confirmation before committing capital.
The Psychology Factor: Why the Right Tool Is Only Half the Battle
Here's what most traders miss: having the right indicator is only part of systematic reversal trading. The other critical component is having the discipline to wait for optimal conditions and execute contrarian trades when your setup aligns.
Remember: the edge is not the system; it's the timing and the discipline.
You can have the best indicator and the most robust set of rules, but if your mindset isn't prepared for the unique pressures of contrarian trading, you will struggle to find consistency. Mastering the tool is only half the battle; mastering your psychological approach is the other half.
Conclusion: Beyond the Indicator
This post demonstrated why a tool like Cumulative Delta Volume can provide clearer signals of trend exhaustion than traditional oscillators. However, it's crucial to remember that a single indicator is not a complete trading system.
A true systematic edge comes from combining a high-quality signal with objective confirmation triggers and the psychological discipline to execute that plan without emotion.
The technical methodology can be learned. The mental frameworks for consistent contrarian execution - that's where most traders struggle.
To discover if you have the psychological framework required for systematic reversal trading, we invite you to DISCOVER YOUR TILT, our free assessment designed to help you identify your mental strengths and potential blind spots as a contrarian trader.